Business KPI dashboard
The numbers that run your business, on one screen
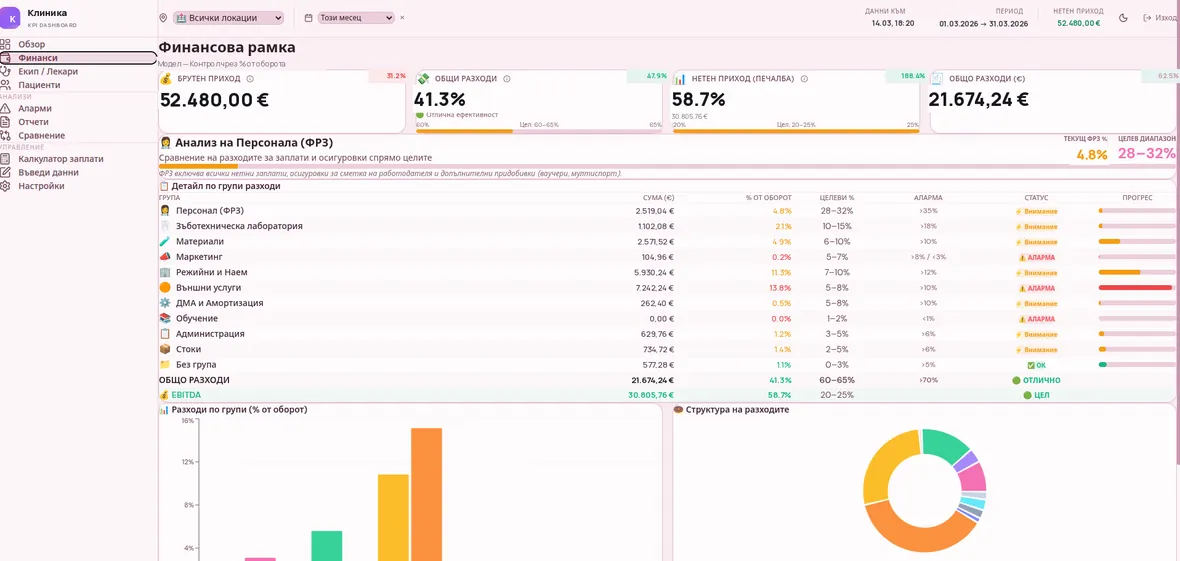
A live dashboard that brings the numbers that matter — revenue, expenses, targets and team performance — onto a single screen. Data flows in automatically, so the picture is always current, and every view is built around the way your business already works instead of forcing a new process on it.
Who is it for?
This is for an owner or a manager who already has the numbers, spread across accounting, a CRM and a spreadsheet, and no single place to look at them. Each deployment is configured to one business rather than sold as a template, because a dashboard whose categories do not match how the team already talks stops getting opened.
What it does
Revenue and expenses
The core financial picture on one screen, always current. Revenue against expenses, month by month, without opening three systems to assemble it.
Team performance
Compare output and results across people and teams over time, so a dip shows up as a trend rather than as a surprise at the end of a quarter.
Automated data pipeline
Numbers flow in automatically from your existing tools, with no manual exports. A manual step gets skipped in exactly the weeks you are busiest, which is exactly when the dashboard matters most.
Targets and alarms
Each KPI has a target range, and alarms flag anything that drifts out of it. A number on its own carries no decision: revenue of 48,000 lv. means nothing until you know whether 48,000 is good.
Built around your workflow
Configured to the metrics and structure your business already uses. If a screen does not match the words a team uses in its own meetings, every glance costs a silent translation, and that friction is what kills the habit.
Built with
React and TypeScript with Recharts for the charts, on Firebase for data and access. Each deployment is wired into the systems the business already runs, so the numbers arrive on their own. A metric that would need a manual export every month is dropped rather than left on screen permanently out of date.
Where it stands
Live and in use. Each installation is configured for a specific business and holds that business’s figures, so there is no public demo to link to.